Hurricane Michael Communications Status Report for October 17, 2018
Areas Impacted by Hurricane Michael
Released On: Oct 17, 2018
The following is a report on the status of communications services in geographic areas impacted by Hurricane Michael as of October 17, 2018 at 11:00 a.m. EDT. Hurricane Michael made landfall on October 10 as a Category 4 hurricane at approximately 1:00 p.m. EDT near Mexico Beach, Florida. This report incorporates network outage data submitted by communications providers to the Federal Communications Commission's (FCC) Disaster Information Reporting System (DIRS) as of 11:00 a.m. DIRS currently covers areas of Alabama, Florida, and Georgia.
The operational status of communications services during a disaster may evolve rapidly, and this report represents a snapshot in time. Although Hurricane Michael had a serious impact on communications services in the Florida Panhandle and parts of Georgia some improvements are evident, especially in wireless services. In Georgia, the percentage of cell sites out of service dropped over the last six days from 14.2% to 0.2%. In the Florida Panhandle, however, the percentage of cell sites out of service remains more significant in several areas. The FCC continues to closely monitor status of communications services, especially in the hardest hit areas.
Disaster Areas
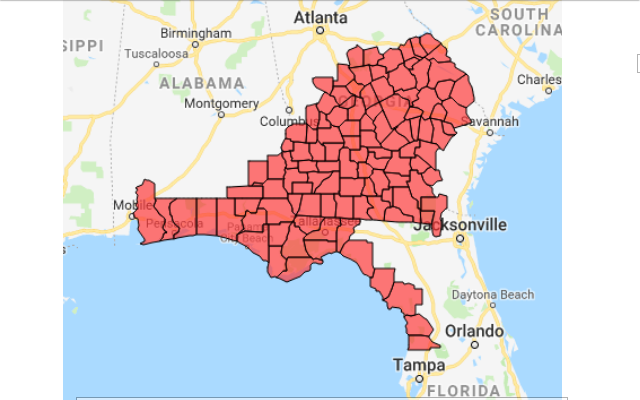
The following 110 counties are in the current geographic area that is part of the DIRS activation (the "disaster area"). Note that on October 11, DIRS activation area was expanded to nine additional counties in Georgia.
ALABAMA: Baldwin, Dale, Geneva, Henry, Houston
FLORIDA: Bay, Calhoun, Citrus, Dixie, Escambia, Franklin, Gadsden, Gulf, Hernando, Holmes, Jackson, Jefferson, Leon, Levy, Liberty, Okaloosa, Santa Rosa, Taylor, Wakulla, Walton, Washington
GEORGIA: Appling, Atkinson, Bacon, Baker, Baldwin, Ben Hill, Berrien, Bibb, Bleckley, Brooks, Bulloch, Burke, Calhoun, Candler, Charlton, Clay, Clinch, Coffee, Colquitt, Columbia, Cook, Crawford, Crisp, Decatur, Dodge, Dooly, Dougherty, Early, Echols, Emanuel, Evans, Glascock, Grady, Hancock, Houston, Irwin, Jasper, Jeff Davis, Jefferson, Jenkins, Johnson, Jones, Lanier, Laurens, Lee, Lowndes, Macon, Marion, McDuffie, Miller, Mitchell, Monroe, Montgomery, Peach, Pierce, Pulaski, Putnam, Quitman, Randolph, Richmond, Schley, Screven, Seminole, Stewart, Sumter, Tattnall, Taylor, Telfair, Terrell, Thomas, Tift, Toombs, Treutlen, Turner, Twiggs, Upson, Ware, Warren, Washington, Webster, Wheeler, Wilcox, Wilkinson, Worth
The following map shows the counties in the disaster area:
911 Services
The Public Safety and Homeland Security Bureau (PSHSB) learns the status of each Public Safety Answering Point (PSAP) through the filings of 911 Service Providers in DIRS, through reporting to the FCC's Public Safety Support Center (PSSC), and through coordination with state 911 Administrators and, if necessary, individual PSAPs.
No PSAPs are reported as being down.
3 PSAPs (no change from yesterday) have been re-routed with ALI:
- Florida: Panama City PD, Tyndall Airforce FD, Tyndall Airforce Law
Wireless Services
The following section describes the status of wireless communications services and restoration in the disaster area, including the percentage of cell sites reported out of service for each county. The following map of the disaster area illustrates which counties are most affected:
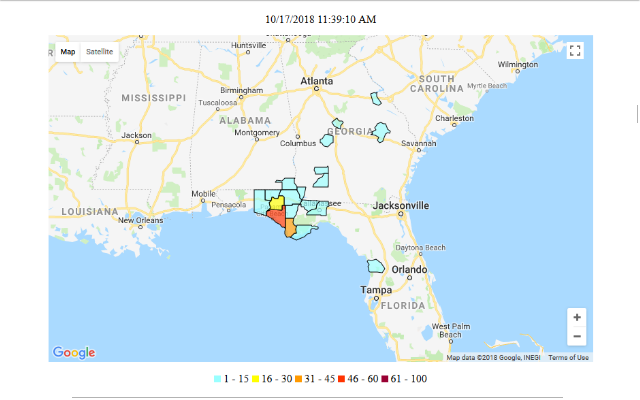
The following table provides cell sites reported out of service by county. There are 3.2% (down from 4.4% yesterday) of cell sites reported out of service in the affected area. There are no counties in the disaster area with more than 50% of the cell sites out of service. The information shown was provided by the signatories to the Wireless Network Resiliency Cooperative Agreement.
Alabama
                          Cell     Cell
State                    Sites    Sites    Percent
Affected    Counties    Served      Out        Out
--------------------------------------------------
AL          BALDWIN        348        0       0.0%
AL          DALE           105        0       0.0%
AL          GENEVA          59        0       0.0%
AL          HENRY           38        0       0.0%
AL          HOUSTON        209        1       0.5%
--------------------------------------------------
TOTAL                      759        1       0.1%
Florida
                          Cell     Cell
State                    Sites    Sites    Percent
Affected    Counties    Served      Out        Out
--------------------------------------------------
FL          BAY            327      151      46.2%
FL          CALHOUN         42        3       7.1%
FL          CITRUS         104        1       1.0%
FL          DIXIE           20        0       0.0%
FL          ESCAMBIA       243        0       0.0%
FL          FRANKLIN        36        3       8.3%
FL          GADSDEN         62        1       1.6%
FL          GULF            23        8      34.8%
FL          HERNANDO       100        0       0.0%
FL          HOLMES          27        2       7.4%
FL          JACKSON         83       11      13.3%
FL          JEFFERSON      261        0       0.0%
FL          LEON           418       32       7.7%
FL          LEVY            70        0       0.0%
FL          LIBERTY          9        0       0.0%
FL          OKALOOSA       225        0       0.0%
FL          SANTA ROSA     165        0       0.0%
FL          TAYLOR          45        0       0.0%
FL          WAKULLA         39        0       0.0%
FL          WALTON         205       21      10.2%
FL          WASHINGTON      39        8      20.5%
--------------------------------------------------
TOTAL                    2,543      241       9.5%
Georgia
                          Cell     Cell
State                    Sites    Sites    Percent
Affected    Counties    Served      Out        Out
--------------------------------------------------
GA           APPLING        38        0       0.0%
GA          ATKINSON        30        0       0.0%
GA             BACON        26        0       0.0%
GA             BAKER        19        0       0.0%
GA           BALDWIN       139        0       0.0%
GA          BEN HILL        18        0       0.0%
GA           BERRIEN        50        0       0.0%
GA              BIBB       169        2       1.2%
GA          BLECKLEY        23        0       0.0%
GA            BROOKS        52        0       0.0%
GA           BULLOCH       136        0       0.0%
GA             BURKE        59        0       0.0%
GA           CALHOUN        41        0       0.0%
GA           CANDLER        33        0       0.0%
GA          CHARLTON        31        0       0.0%
GA              CLAY        12        0       0.0%
GA            CLINCH        33        0       0.0%
GA            COFFEE        61        0       0.0%
GA          COLQUITT        78        0       0.0%
GA          COLUMBIA       165        0       0.0%
GA              COOK        36        0       0.0%
GA          CRAWFORD        21        0       0.0%
GA             CRISP        46        0       0.0%
GA           DECATUR        60        0       0.0%
GA             DODGE        52        0       0.0%
GA             DOOLY        32        0       0.0%
GA         DOUGHERTY       124        1       0.8%
GA             EARLY        18        0       0.0%
GA            ECHOLS        22        0       0.0%
GA           EMANUEL        59        1       1.7%
GA             EVANS        19        0       0.0%
GA          GLASCOCK         5        0       0.0%
GA             GRADY        42        0       0.0%
GA           HANCOCK        27        0       0.0%
GA           HOUSTON       173        0       0.0%
GA             IRWIN        18        0       0.0%
GA            JASPER        31        0       0.0%
GA        JEFF DAVIS        24        0       0.0%
GA         JEFFERSON       275        0       0.0%
GA           JENKINS        17        0       0.0%
GA           JOHNSON        15        0       0.0%
GA             JONES        49        0       0.0%
GA            LANIER        21        0       0.0%
GA           LAURENS        84        0       0.0%
GA               LEE        91        0       0.0%
GA           LOWNDES       163        0       0.0%
GA             MACON        39        1       2.6%
GA            MARION        29        0       0.0%
GA          MCDUFFIE        45        1       2.2%
GA            MILLER         8        0       0.0%
GA          MITCHELL        36        1       2.8%
GA            MONROE        53        0       0.0%
GA        MONTGOMERY        69        0       0.0%
GA             PEACH 46 0 0.0%
GA            PIERCE 39 0 0.0%
GA           PULASKI 27 0 0.0%
GA            PUTNAM 40 0 0.0%
GA           QUITMAN 4 0 0.0%
GA          RANDOLPH 21 0 0.0%
GA          RICHMOND 290 0 0.0%
GA            SCHLEY 9 0 0.0%
GA           SCREVEN 30 0 0.0%
GA          SEMINOLE 86 1 1.2%
GA           STEWART 18 0 0.0%
GA            SUMTER 75 0 0.0%
GA          TATTNALL 36 0 0.0%
GA            TAYLOR 42 0 0.0%
GA           TELFAIR 31 0 0.0%
GA           TERRELL 19 0 0.0%
GA            THOMAS 76 0 0.0%
GA              TIFT 69 0 0.0%
GA            TOOMBS 57 0 0.0%
GA          TREUTLEN 21 0 0.0%
GA            TURNER 30 0 0.0%
GA            TWIGGS 49 0 0.0%
GA             UPSON 32 0 0.0%
GA              WARE 73 0 0.0%
GA            WARREN 23 0 0.0%
GA        WASHINGTON 42 0 0.0%
GA           WEBSTER 17 0 0.0%
GA           WHEELER 8 0 0.0%
GA            WILCOX 32 0 0.0%
GA         WILKINSON 31 0 0.0%
GA             WORTH 53 0 0.0%
--------------------------------------------------
TOTAL 4,442 8 0.2%
The number of cell site outages in a specific area does not necessarily correspond to the availability of wireless service to consumers in that area. See Improving the Resiliency of Mobile Wireless Communications Networks, Order, 31 FCC Rcd 13745, para. 10 (2016) (recognizing the difficulties in accurately depicting the ongoing status of a wireless provider's service during emergencies). Wireless networks are often designed with numerous, overlapping cell sites that provide maximum capacity and continuity of service even when an individual site is inoperable. Moreover, wireless providers frequently use temporary facilities such as cells-on-wheels, increased power at operational sites, roaming agreements, or take other actions to maintain service to affected consumers during emergencies or other events that result in cell site outages.
Cable Systems and Wireline (Combined)
The cable system and wireline outage table reflects outages of communications service provided by cable and wireline companies in the impacted area, which may include the loss of telephone, television, and/or Internet services.
State Subscribers Out of Service AL 517 FL 112,402 GA 38,129
Broadcast
Television stations status:
28 (no change from yesterday) TV stations reported being operational (WABW, WACS, WALATV, WALB, WCES, WDHN, WEIQ, WFLA-TV, WFNA, WGNM, WJCL, WJSP, WJTC, WKRG-TV, WMBB, WMOR-TV, WMUM, WPAN, WPMI, WRBL, WRMD-CD, WSAV-TV, WSCG, WTTA, WTXL, WVAN, WVUP-CD, WXGA).
1 (no change from yesterday) TV station reported being out of service (WFXL).
FM Radio stations status:
102 (up from 101 yesterday) FM radio stations reported being operational (W201DJ, W204CM, W206BP, W209CD, W209CG, W212BY, W214BZ, W219DH, W220DS, W232BI, W233AP, W242BF, W245BT, W259CA, W266CM, W269BJ, W271BC, W279CU, W287CG, W290AS, WAAC, WABD, WABR, WAKU, WASU-LP, WBBQ-FM, WBLX-FM, WBYZ, WBZE, WCSN-FM, WCUG, WDBN, WDEN-FM, WDLT-FM, WDLV, WEBZ, WFLA-FM, WFLF-FM, WFRP, WFSY, WGCN, WGEX, WGLF, WGMY, WGOV-FM, WHBX, WHHR, WIBB-FM, WIFO, WIZB, WJIZ-FM, WJSP-FM, WJWV, WKAA, WKAK, WKKZ, WKSM, WLGK, WLOV-LP, WLUB, WLXF, WLZN, WMCG, WMGB, WMRZ, WMUMFM, WNCV, WNUQ, WOBB, WPAP, WPEZ, WPLV, WQBZ, WQIL, WQPW, WQTS, WQXZ, WQZY, WSTI, WSVH, WTCQ, WTGF, WTNT-FM, WTSM, WUNV, WVGA, WVKV, WWET, WWLD, WWLD, WWRQ, WWWD, WXHT, WXJB, WXRA, WXSR, WXVS, WYCT, WYUM, WYZB, WZCH, WZNS).
13 (no change from yesterday) FM radio stations reported being out of service (WASJ, WBMZ, WEGC, WHKV, WJAD, WJEP, WKIH, WKNK, WPFM, WQVE, WRBA, WSWL-LP, WZRE-LP).
1 (no change from yesterday) FM radio station reported being down with programming sent to another station (WXRS).
AM Radio stations status:
23 (up from 22 yesterday) AM radio stations reported being operational (WALG, WAYS, WCLA, WDAK, WEBY, WFTW, WGSY, WGUN, WHBT, WHEP, WJAT, WJYZ, WLOP, WMAC, WMLT, WNRP, WTLY, WVLD, WVOP, WWIO, WWJB, WXLI, WXQW).
2 (down from 3 yesterday) AM radio stations reported being out of service (WDIZ, WXRS)
As prepared by the Federal Communications Commission: October 17, 2018 11:00 a.m. EDT
The above info was copied from the FCC's annoying PDF file preference, found on this page (docs.fcc.gov).
The FCC provides text and PDF versions of the reports, but both formats do not display within the web browser. My browser automatically downloads each format to my local file system. I assume that FCC's web server does not support sending .txt and .pdf formats, or something like that.
But why does the FCC NOT create an HTML version? It's easy to do.
In section of the report that showed cell service by county, the FCC displayed the info in tabular format. I choose to display the info as a code block, instead of using HTML table tags.